Dashboard
Support for Sankey and other graph options for NetFlows in Dashboard 2.0
The NetFlows tile now supports Pie and Bar charts.
Pie chart enhancements including support for NetFlow tile
The NetFlow tile now supports pie chart visualization based on the data flow from interfaces.
End of life for Classic Dashboards
As announced earlier, Classic Dashboards are retired and not accessible from this update. You must use modern dashboards.
Value mapping for count visualization
The Value Count visualization when grouped by States is now visually consistent with system default color interpretation for Resource availability, Alert, and Incident states.
Scheduling Dashboard Reports
Scheduling dashboard reports has been updated to support tiles with larger quantities of data.
Core Platform
InstalledSoftwares attribute added to Resource filters
The installedSoftwares attribute has been added to Resource filters in both Classic device management policies (DMP) and Template-based Alert Definitions.
This enhancement enables more precise filtering based on installed software, making it easier to create targeted and effective policies for monitoring required software services. As a result, you can better manage and track specific software across resources.
Tenancy and RBAC
Permission-based command access for View-Only users
Run Commands at the Resource level now supports a tiered permission model. Users with Devices View, Devices Edit, or Devices Create and Allow to Run Commands permissions can execute read-only diagnostic commands without requiring Device Manage access.
What’s New:
- Users with Devices View, Devices Edit, or Devices Create and Allow to Run Commands can run diagnostic commands such as CPU/Memory Usage, Disk Usage, Hostname, IPConfig, NSLookup, Ping, Processes, System Info, and more.
- State-changing commands (for example, Disable Windows Auto Update, Internal OpsRamp Agent Command, Restart OpsRamp Agent, Restart Remote OpsRamp Agent, Execute a Command) continue to require Device Manage permission.
- The command list is dynamically filtered based on user permissions.
This enhancement enables least-privilege access, allowing support users to run diagnostics without granting full device management permissions, improving security and efficiency.
Resource Management
OpenSSH/ED25519 Key format support for Linux Agentless (SSH) Credentials
OpsRamp now supports OpenSSH/ED25519 key formats when configuring Linux OS - Agentless (SSH) type credentials.
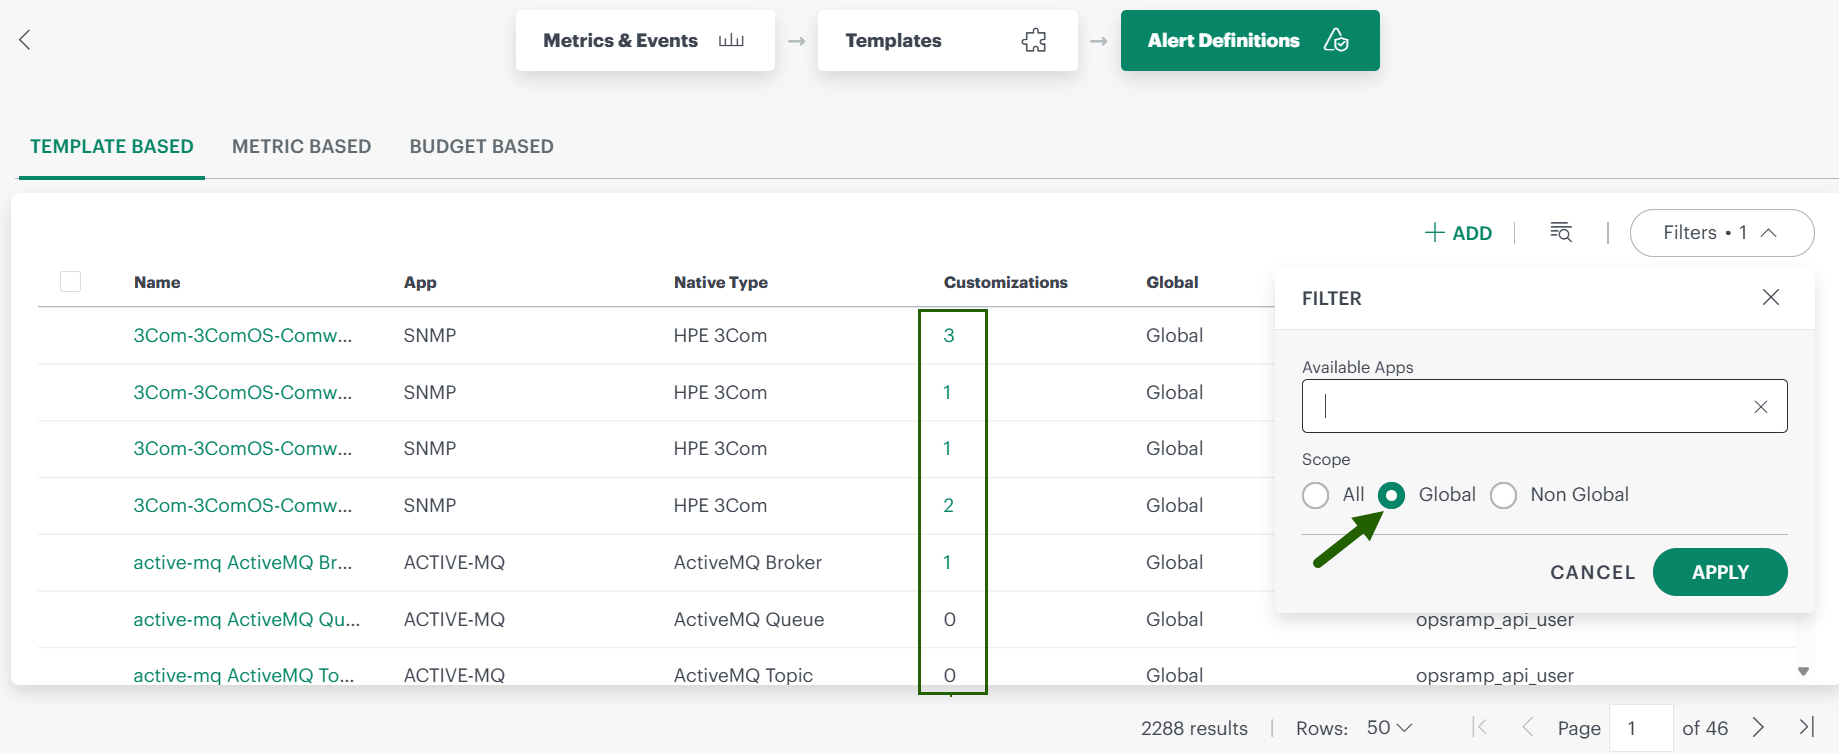
View customization count for Global Template-Based Alert Definitions
You can now view the number of customizations for each global Template-based Alert Definition on the Template-Based Alert Definitions listing page. This enhancement gives you insight into how many customizations exist for each definition.
- View counts via filter: Use the filter with Global scope to see the number of customizations for each Alert Definition.
- See detailed customizations: Click a number to view the specific customizations applied.
Availability
Availability Report should consider the unmanaged and deleted resources
Resource Availability Report Enhancement Now you have an option to include the DELETED and UNMANAGED resources information in the Availability report. With this option, you can include the resources that were not part of the inventory at the time of report generation. Refer to the documentation.
Event Management
Alert processing flow enhancement
Alert processing now starts with First Response policies check and then moves to Alert Correlation policies check. This enhancement filters out suppressed Alerts from going to correlation and reduces load on the Alert Correlation engine.
Service Management
Partner user support for client-specific Service Desk ticket status flows
Partner users can view and use status flows at both Client and Partner Account levels.
Incident notes update timestamp
Whenever Incident ticket notes are updated, users can see the updated time in the “Last Updated” field.
Monitoring Management
Enhanced SNMP trap processing with self-service UI and MIB parser
SNMP trap processing - Self Service OpsRamp now introduces a self-service capability to configure and manage SNMP trap processing directly from the UI. You can upload MIB files to automatically parse trap definitions and add them to your scope (Service Provider, Partner, or Client). You can also view, search, and customize trap definitions, including severity, alert subject, and processing behavior. You can copy global trap definitions into your scope (Service Provider, Partner, or Client) and modify them without affecting other tenants. Scoped configurations take precedence over global definitions, enabling flexible and tenant-specific customization. This enhancement reduces dependency on backend configuration and helps you onboard vendor-specific SNMP traps faster.
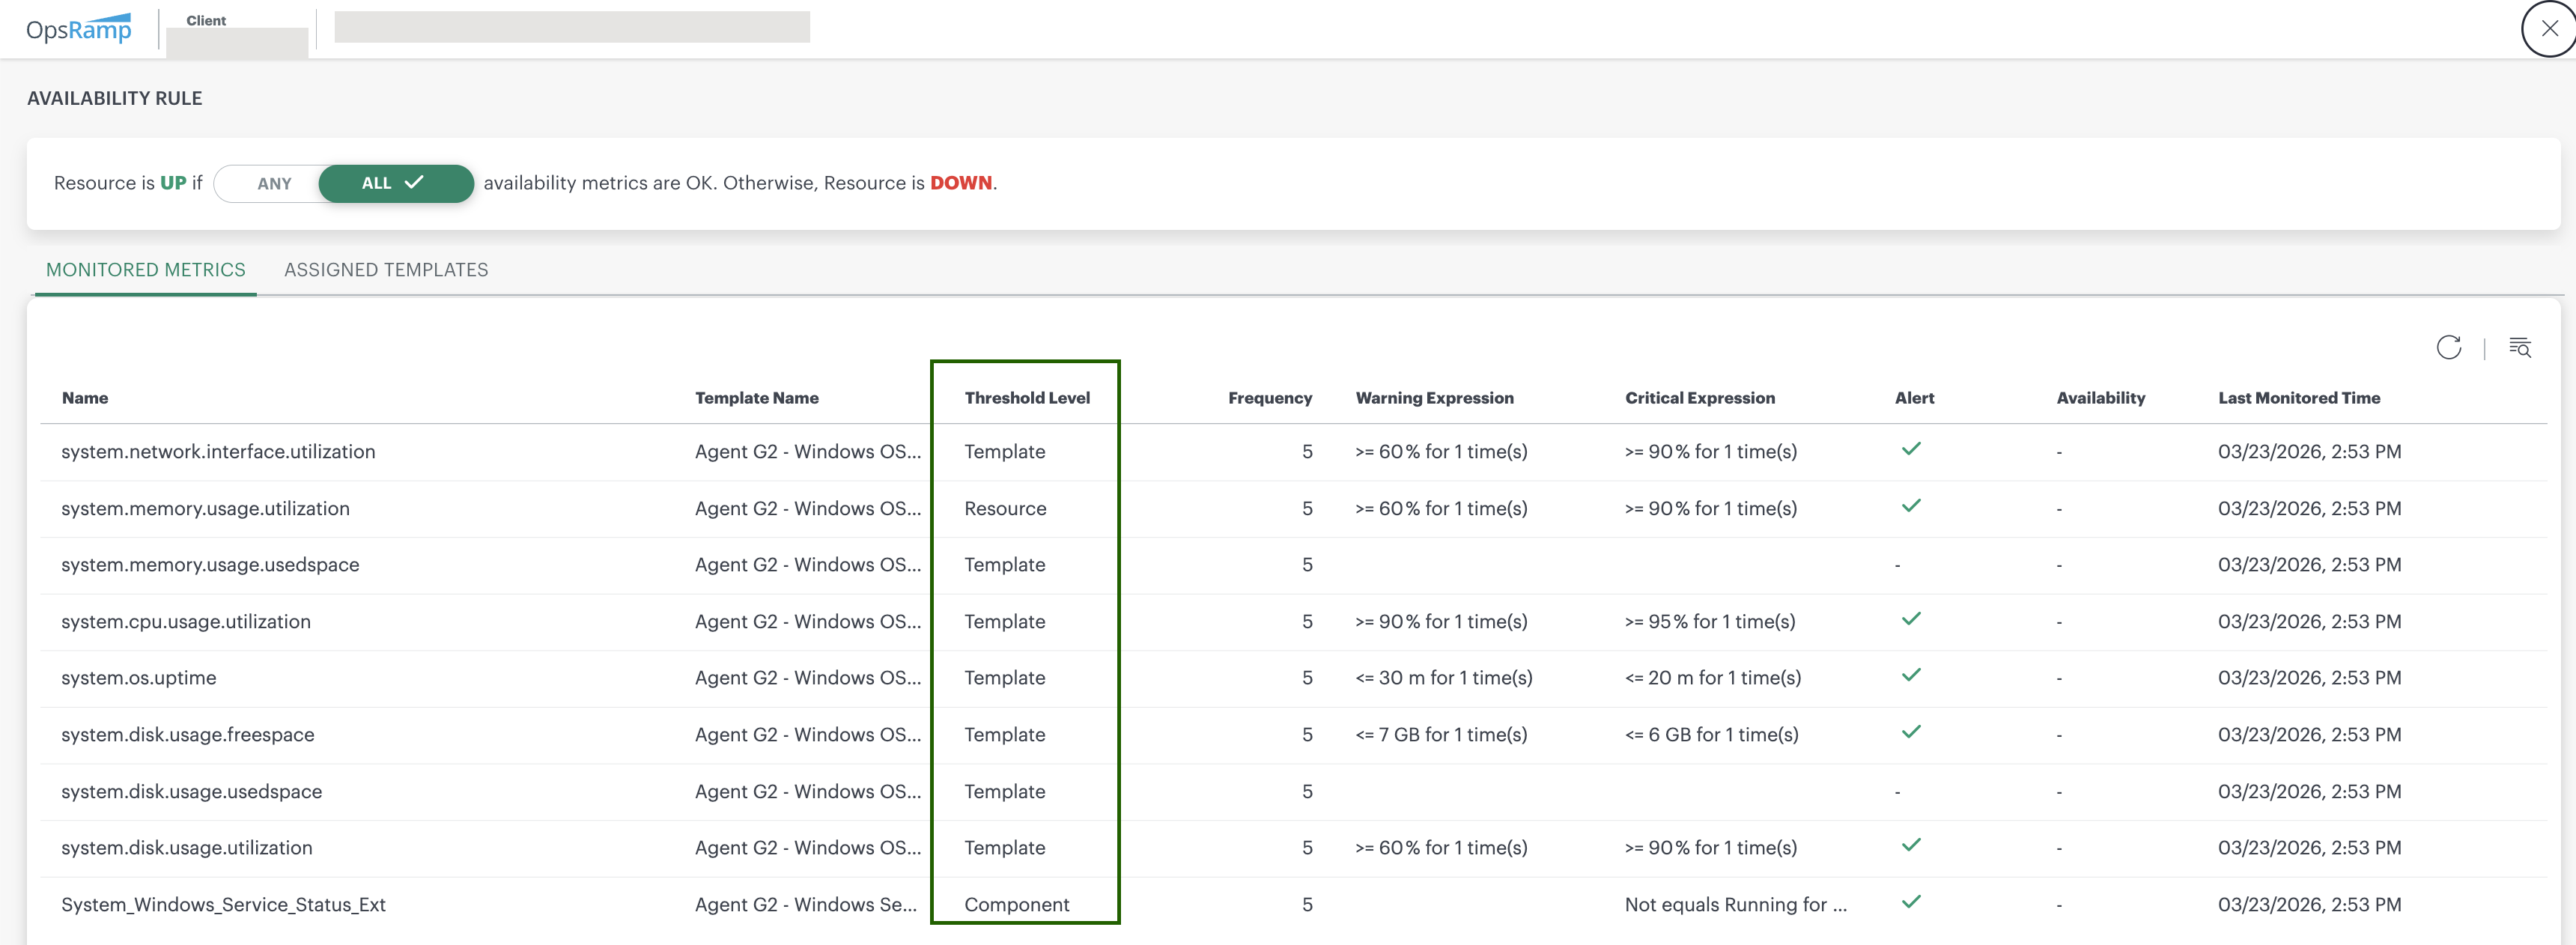
Enhanced visibility for metric level Alert customization Thresholds
OpsRamp now provides improved visibility into Metric Level Alert Customization Thresholds for monitored resources. You can view the configured Thresholds directly as Threshold Level values in View Monitoring Configuration > Monitored Metrics. This enhancement allows you to quickly review threshold levels for all monitored Metrics without opening each Metric individually.
Alert Definition Moved Under the Monitoring card
As part of the phased rollout of the v2 Monitoring UI, the existing Alert Definition option previously available under Setup > Account has been reorganized and moved to Setup > Account > Monitoring > Alert Definition > Metric Based.
In addition, the Setup > Account > Monitoring option is now structured as follows:
Under Metrics & Events Tab: Metrics, Events, Syslog Rules, and SNMP Traps

Under Templates Tab: Templates

Under Alert Definitions Tab: Template Based, Metric Based, and Budget Based

Refer to the Monitoring documentation for more details.
Note
If you do not see Template Based and Budget Based options under the Alert Definitions Tab, your Client is not enabled to use the v2 Monitoring UI. You will see this update in future releases.- Template Based is a replacement for Setup > Setup > Resources > Device Management Policies
- Budget Based is a replacement for Setup > Setup > Monitoring > Budget Policies
Patch Management
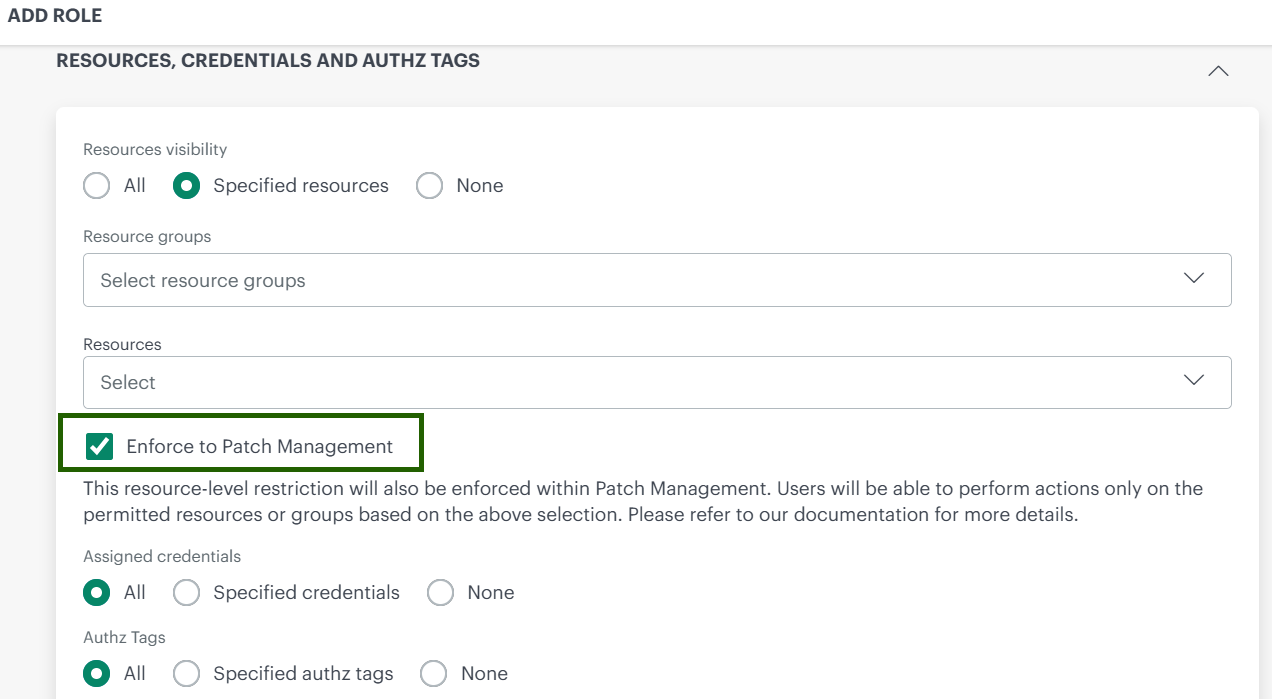
RBAC enforcement for Patch Management Enhancement
Patch Management now enforces Role-Based Access Control (RBAC) to ensure users can only view, manage, and approve patch jobs for the resources and Resource Groups assigned to them. Previously, users with patch approval permissions could access and manage patch jobs across all Resource Groups, which could lead to accidental or unauthorized patching. This update improves security and governance by restricting patch operations to a user’s assigned scope.
Scripts v2 usability and execution improvements Enhancement
The Scripts v2 feature has been enhanced to improve usability, visibility, and execution flexibility. These updates streamline script management, improve execution monitoring, and strengthen security across different user scopes:
- The Scripts v2 user interface has been refreshed to provide a cleaner look and a smoother, more intuitive user experience.
- Script categories and script lists are now displayed based on user scope. Service Provider (SP) users see only SP‑specific scripts, while Partner users can view both SP and Partner scripts, with management restricted for SP‑owned scripts.
- A new View Execution option allows users to track the execution status of scripts directly from the UI.
- Users can now view detailed execution logs, making it easier to monitor outcomes and troubleshoot failures.
- Script details can be exported in CSV format, enabling easy reporting and offline analysis.
- Script scheduling has been enhanced to support both manual and dynamic Resource assignments, providing greater flexibility compared to the earlier manual‑only approach.
- Resource query search has been improved to enable searching scripts by name within the selected category.
- A new Run Now option on the Schedule Job page enables users to execute scripts immediately from the Resource selection screen.
- Users can now create, update, and delete script categories to better organize and manage scripts across global, Partner, and Client scopes.
Process Automation
Increased OpsRamp Gateway loop count limit Enhancement
The maximum loop count for OpsRamp Gateway definitions in process workflows has been increased from 10 to 20. This enhancement allows automation plans to run checks more frequently over a longer duration.
See Define Automation Process for more information.
Added “Credentials in Script” Option for Script Tasks Enhancement
A new Credentials in Script option is now available when creating a Script Task. This enhancement allows you to securely pass one or more credentials to scripts during execution.
With this capability, you can run remote scripts on network devices through the OpsRamp Gateway using Process Automation. The option supports multiple credentials, enabling greater flexibility when executing scripts across different devices and environments.
Note
This is available from 21.0.0 OpsRamp Agent version.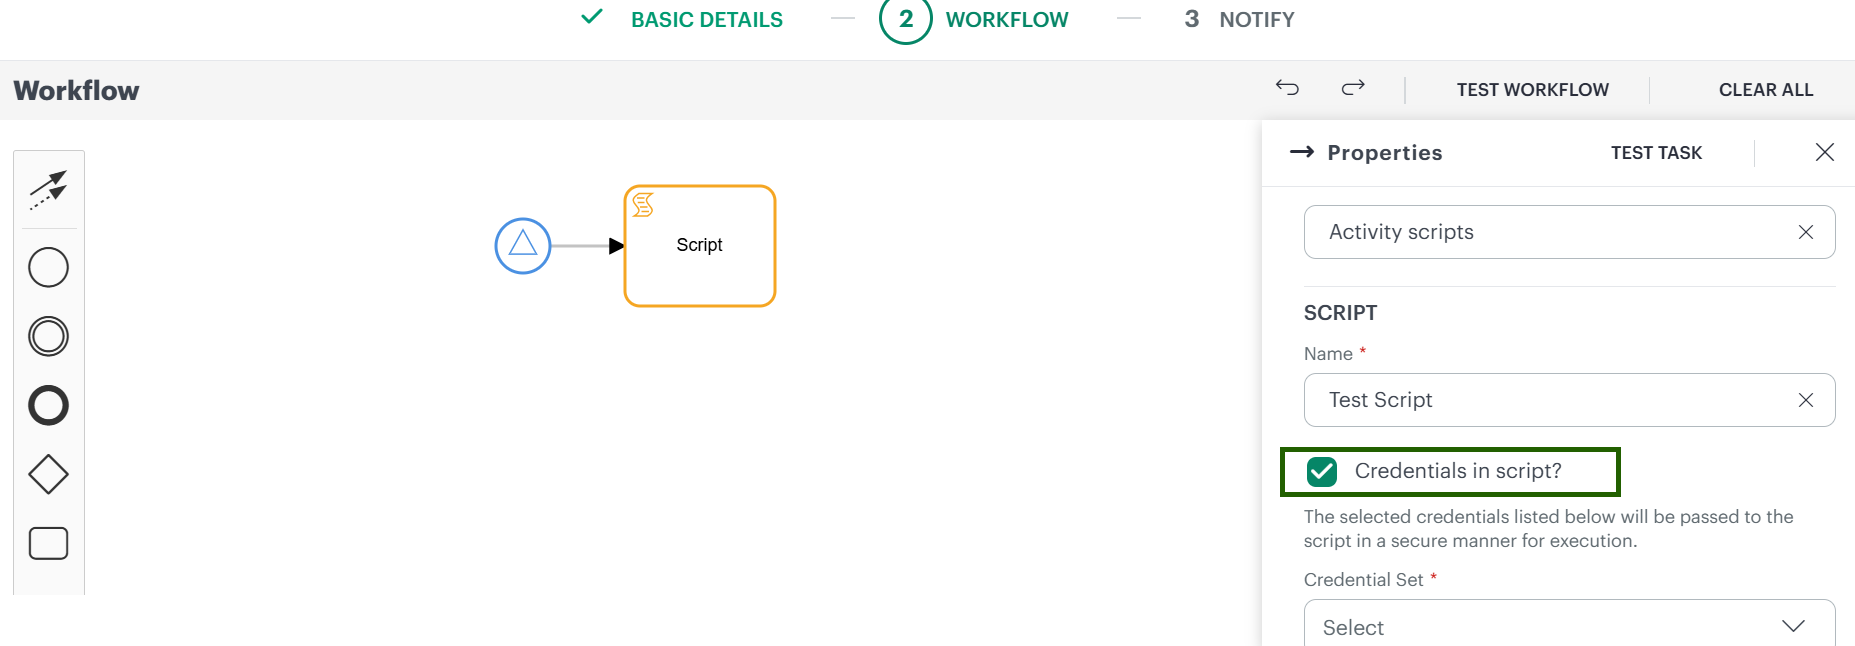
See Process Definition Reference for more information.
Network Topology Management (NTM)
Support for L3 IPsec Tunnel in Topology Explorer
SNMP Integration now discovers and visualizes Layer 3 IPsec tunnel links for Cisco and Fortinet devices through Network Topology page, similar to how OSPF and BGP links are displayed. This enhancement provides end‑to‑end visibility of IPsec Tunnel connectivity.
Reporting Apps
Availability report includes deleted and unmanaged resources Enhancement
The app now includes the capability to display availability information for DELETED and UNMANAGED resources within the Availability Details Reporting App.
This important new feature allows users to view resources that were not part of the active inventory at the time the report was generated. As a result, it provides a more comprehensive overview of overall Resource status, helping users gain better insights into Resource historical data and its availability.
To view deleted resources availability
Select the Include Deleted Resources option to view deleted Resource availability. This option activates when the user selects “Availability By” as “Resource.” This data appears in a new XLS sheet titled “Deleted Resources Summary.”
To view unmanaged resources availability
User selects “Availability By” as “Resource” option and updates the OpsQL query to state = “inactive” to include unmanaged resources availability. This data appears in the existing sheet called “Availability Summary - Resources.”
Reboot details in patch details app Enhancement
The Patch Details app now displays a reboot required column at the Resource level. This enhancement allows users to reboot the Resource only when necessary or at their specified time, rather than immediately after every patch installation. In addition, the app also provides columns showing the Last Reboot Date and the Last Rebooted By. These additions offer users more detailed information and enable better tracking of reboot activities.
Integration Activity App
Integration Activity is a new app designed to display all actions and activities occurring between third-party tools and the OpsRamp Platform. It meticulously tracks every Event, providing users with the ability to closely monitor the Integration activity and its statuses. This app plays a crucial role in supporting auditing, troubleshooting, and ensuring transparency within Integration workflows that connect third-party Integration tools with the OpsRamp Platform.
Copilot Usage Insights App
The Copilot Usage Insights App offers a comprehensive and detailed overview of how the AI copilot is being utilized throughout the entire organization. It provides a thorough breakdown of usage statistics, categorized by different agents and large language models (LLMs). Additionally, the app provides user adoption behavior and calculates the success rate percentage, giving valuable insights into the effectiveness and engagement levels of the AI copilot.
Public Cloud
Cradlepoint Interface Metrics Enhancement
With this release, two new interface-level Metrics have been introduced for Cradlepoint Integrations, providing enhanced visibility into interface availability and operational status.
New Metrics:
- Interface Connection State (cradlepoint_interface_connection_state)
- Indicates the current connection status of the interface:
- 1 = Connected, 0 = Disconnected, 3 = Unknown
- Interface Uptime (cradlepoint_interface_uptime)
- Represents the total duration the interface has been active, reported in seconds.
Microsoft 365 Service Incident Alerting
Introduced support for automatic ingestion of Microsoft 365 Service Incident Events using Microsoft Graph APIs. This enables Alert generation for service Incidents, allowing OpsRamp to automatically create and resolve Alerts based on the Incident status in Microsoft 365.
Alerts are generated at the service level and are marked as critical while the Incident is active. Once the Incident is resolved by Microsoft, the corresponding Alerts are automatically healed.
You can configure the polling frequency (15-60 minutes) to control how often service Incidents are checked. This enhancement improves visibility into Microsoft 365 service health and supports proactive Incident response.
Note
Only service Incidents are supported; advisories are not included.Log Management
Standardized Log Severity Level Mapping
OpsRamp Log Management now includes expanded and standardized mappings for log severity levels.
Log filtering support for Log archival
OpsRamp now supports log filtering under the log archival feature. You can optionally define filters to archive only matching logs to an AWS S3 bucket. If no filter is specified, all client logs are archived by default.
Tracing
Client‑side vs Server‑side Span Duration Visibility
OpsRamp Distributed Tracing now supports client‑side and server‑side span duration visibility for service‑to‑service calls. You can compare caller span duration with receiver span duration to identify network latency and infrastructure overhead impacting transactions.
Integration Framework
Configurable Email Notifications for Event Retry Outcomes
OpsRamp now allows you to receive email Notifications based on the outcome of Event retry attempts:
- Notify on Retry Success: Receive emails when a retry attempt succeeds.
- Notify on Retry Failure: Receive emails when a retry attempt fails.
- Both options selected: Notifications are sent for retry outcomes, whether successful or failed.
Note
This feature applies to Integrations that support outbound Events, such as Custom, Ticketing, and Custom (Ticketing) Integrations.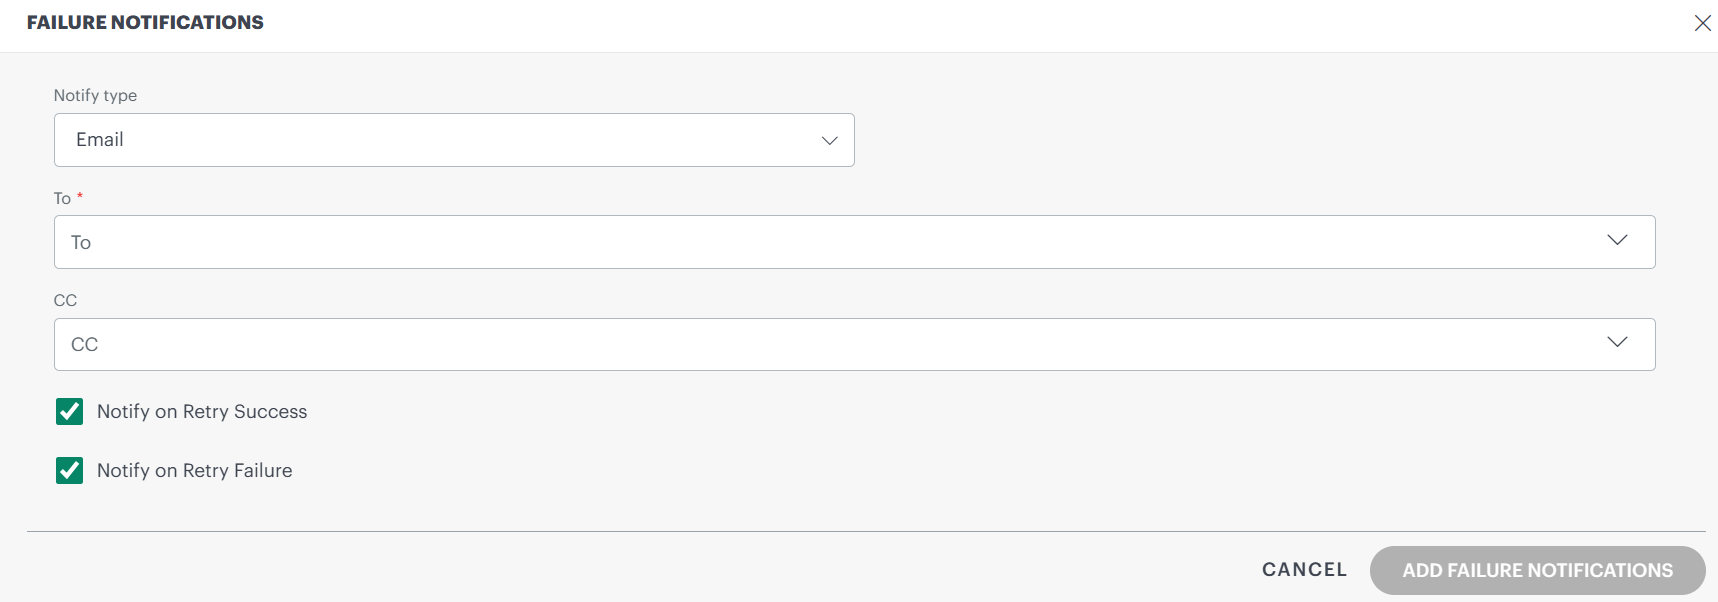
OpenID Connect (OIDC) Single Sign-On
OpenID Connect (OIDC) SSO with Just-In-Time (JIT) user provisioning is now available as an additional authentication option for Okta and Custom SSO integrations, alongside the existing SAML SSO.
Key capabilities:
- Full Authorization Code Flow with PKCE support
- State and nonce-based CSRF and replay protection
- RS256 ID Token validation using cached JWKS
- IdP-initiated logout support
- Seamless configuration using existing SSO configuration entity with new OIDC-specific fields (client ID, client secret, token endpoint, JWKS URI)
Just-In-Time (JIT) User Provisioning
Automatically create and update user accounts at login time using identity provider claims.
Benefits:
- Automatic user provisioning from OIDC /userinfo endpoint claims
- Reuses existing attribute mapping configuration from SAML JIT
- Zero additional setup required
Migration
No changes are required for existing SAML SSO customers. OIDC is available as an optional alternative authentication method.
End-of-Life Announcement
Classic Custom Attributes UI removed
The Classic Custom Attributes screens that were earlier marked as deprecated are now removed from the OpsRamp Platform. This change finalizes the previously announced deprecation notice. You are encouraged to transition to the new Custom Attributes UI (under Setup > Account > Custom Attributes) to benefit from an improved user experience.
Your existing data configured in the Classic Custom Attributes UI continues to be available and visible in the new Custom Attributes UI, ensuring continuity and allowing you to access and manage your previously defined attributes without any disruption.
Upcoming Releases
Movement of Features from Resources and Monitoring Sections to Alternative UI Locations
As part of the transition to the new OpsRamp UI, several legacy options under Setup > Setup > Resources and Setup > Setup > Monitoring are being moved to new locations or deprecated. Some pages that are no longer required will be removed in upcoming releases.
Resources UI Options
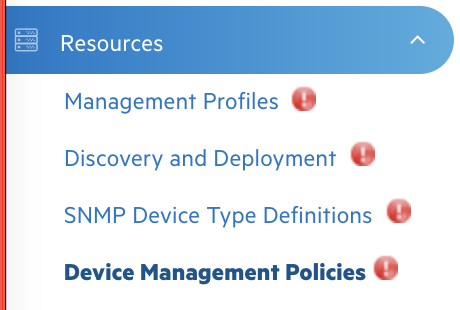
Management Profiles
As announced earlier in H1-2024, Setup > Setup > Resources > Management Profiles will be removed in June 2026 release. You can start using this feature under Setup > Account > Collector Profiles.
Discovery and Deployment
Setup > Setup > Resources > Discovery and Deployment will be completely removed in June 2026 release. The alternative option is available under Setup > Integrations > SNMP.
SNMP Device Type Definitions
As announced earlier in H2-2025, Setup > Setup > Resources > SNMP Device Type Definitions will be removed in June 2026 release. The alternative option is available under Setup > Account > Integrations > SNMP.
Device Management Policies
Setup > Setup > Resources > Device Management Policies will be removed in upcoming releases, and existing policies will be moved to two different locations as mentioned in Template-Based Alert Definitions. OpsRamp will migrate your existing data automatically.
Monitoring UI Options
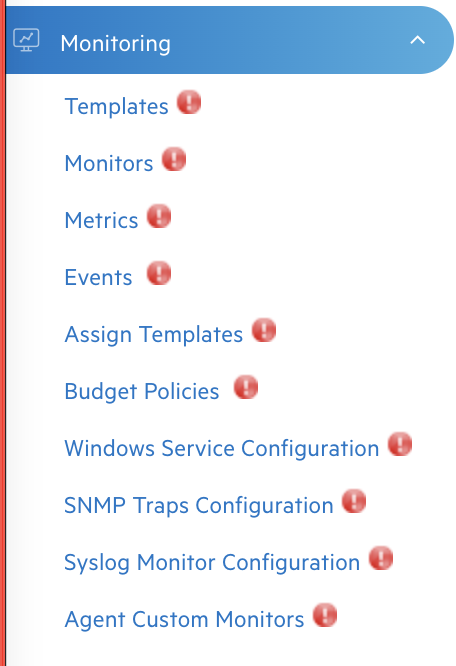
Templates
Setup > Setup > Monitoring > Templates will be removed in June 2026 release. All existing templates and global templates will be available under Setup > Account > Monitoring > Templates.
Monitors
Setup > Setup > Monitoring > Monitors will be completely removed in June 2026 release. As announced earlier in H2-2024, there is no alternative page or option.
Note
Monitors that are created and not used in any template will not be available in future releases.Metrics and Events
Setup > Setup > Monitoring > Metrics/Events will be removed in June 2026 release. All existing metrics and events, along with global metrics and events, will be available under Setup > Account > Monitoring > Metrics & Events.
Assign Templates
Setup > Setup > Monitoring > Assign Templates will be completely removed in June 2026 release. Alternatively, go to Infrastructure > Search, search for resources, select them, and click Actions > Assign Templates.
Budget Policies
Setup > Setup > Monitoring > Budget Policies will be removed in June 2026 release. All existing policies will be available under Setup > Account > Monitoring > Alert Definitions > Budget Based.
Windows Service Configuration
Setup > Setup > Monitoring > Windows Service Configuration will be completely removed in June 2026 release. As announced earlier in H2-2024, there is no alternative page or option.
SNMP Traps Configuration and Syslog Monitor Configuration
As announced earlier in H2-2024, Setup > Setup > Monitoring > SNMP Traps Configuration and Syslog Monitor Configuration will be removed in June 2026 release. All existing configurations are available under Setup > Account > Integrations > SNMP Traps Configuration and Setup > Account > Integrations > Syslog Monitor Configuration.
Agent Custom Monitors
As announced earlier in H2-2024, Setup > Setup > Monitoring > Agent Custom Monitors will be completely removed in June 2026 release with no alternative option available.
You can create a template with the template type Remote Script Executor Agent under Setup > Account > Monitoring > Templates.